Plus Two Economics-Chapter 12
Chapter 12:-

Introduction In the previous chapters we learned about equilibrium state in a closed economy. But modern economies are not closed ones, they are open economies. An open economy is an economy which has economic relations with other countries of the world with regard to goods and services, financial assets, etc. Broadly speaking, open economies create three types of linkages.
Linkages in International Trade
1. Product Market Linkage: Consumers can buy products both domestic and foreign. Product market is enriched with goods imported from abroad. This is called product market linkage.
2. Financial Market Linkage: Investors can choose to invest in domestic or foreign assets. In an open economy with fully convertible currency, they can buy financial securities like bonds and shares. This is financial market linkage.
3. Factor Market Linkage: Factor market linkage involves free movement of factors of production. Firms can choose to invest abroad, if interested. Similarly labour can work abroad if they choose. Even though factors of production enjoy free movement, in effect, they are controlled by immigration and investment regulations.
Leakage, Injection and Openness of an Economy
An open economy influences aggregate demand. Imports, exports, borrowing and lending can influence aggregate demand. Imports reduce aggregate demand and exports increase aggregate demand. How does this happen ? When India imports, money flows from India to countries from which we import. This is a leakage from the circular flow of income and expenditure within the economy. This reduces aggregate demand. When we export, money flows into India. This increases aggregate demand. This is the injection to the circular flow of income. Therefore, the volume of imports and exports is an important factor determining aggregate demand. The volume of trade is also an indicator of the openness of an economy. Sum total of imports and exports (total foreign trade) as a proportion of GDP is a common measure of the degree of openness of our economy. For India, presently foreign trade accounts for 38 per cent of GDP. This was only around 16 percent in 1985-86. This means that Indian economy has become more open in recent times.
Balance of Trade and Balance of Payments
Balance of Trade – BoT International trade has two dimensions – imports and exports. When we export, we earn foreign exchange, and when we import, foreign exchange flows out of the country. The difference between the value of visible import and visible exports is called Balance of Trade.
While calculating the balance of trade, visible items are considered. Visibles refer to the items that are recorded at the ports. Machinery, raw material, textiles, agricultural products, etc., are visible items. Invisible items refer to services and they are not included in the balance of trade. If the value of a country’s exports is greater than that of its imports, that country has Trade Surplus. In this case, the country in question has a favourable balance of trade. Conversely, if the value of exports is less than the value of imports, the country has a Trade Deficit. This is called unfavourable balance of trade.Balance of Payments – BoP Balance of payments is a more comprehensive term than balance of trade. Balance of Payments is a summary record of a country’s monetary transactions with the rest of the world in a year. It includes both visible items and invisible items. A country can earn foreign exchange through the export of invisible items also. Banking, shipping, insurance, air transport, etc., are services that fetch foreign exchange. They are known as invisible items. Earnings from export of computer software, services rendered with the use of information technology (IT enabled services), money sent home by Indians working abroad, etc., come under invisible items.

Balance of trade is the record of visible exports and visible imports. This includes only visible items.
Balance of payment is the record of all monetary transactions with the rest of the world. This includes visible items and invisible items.| Table 12.1 Balance of Trade versus Balance of Payments | |
| Balance of Trade | Balance of Payments |
| 1) Includes only visible items | Both visible and invisible items |
|---|---|
| 2) Excludes capital accounts | Includes capital accounts |
| 3) Narrower concept | Broader concept |
| 4) May be surplus, deficit or balanced | Always balanced |
Balance of Payments Accounting Double entry book keeping system is used in balance of payments accounting. Any transaction that causes outflow of foreign exchange is recorded on the debit side. This bears a negative symbol. But any transaction that causes – inflow of foreign exchange is recorded on the credit side. Its symbol is positive. BoP has four accounts:
1. Current Account
2. Capital Account
3. Official/Reserve Settlement Account
4. Errors and Omissions. They are explained in detail.
1. Current Account The current account consists of all transactions relating to trade in goods and services and transfer payments. Goods or commodities traded are called visibles. Services are invisibles like travel, transportation, banking, insurance, etc. Transfer payments are unilateral payments made to foreigners and received from foreigners. Receipts from current account transactions are called current receipts. Expenditure on current account transactions are called current expenditure. If a country’s current receipts are more than current expenditure, it is called current account surplus. If a country’s current expenditure is more than current receipts it is called current account deficit. If current account receipts and curren, account expenditure are equal. It is called current account balanced. Current account deficit has to be bridged through surplus in the capital account.
2. Capital Account Capital account shows flow of capital. All transactions like lending, borrowing and investment come under capital account. Lendings and borrowings include both short term and long term transactions. Investment includes both direct investment and portfolio investment. If the capital receipts into a country are more than the capital receipts out of the country, it is called capital account surplus. If capital receipts into a country are less than the capital receipts out of the country, it is called capital account deficit. It should be noted that the current account deficit is financed through capital account surplus.
3. Official/Reserve Settlement Account Excess of foreign exchange receipts over foreign exchange expenditure results in surplus. This surplus is treated as reserves and shown in the reserve account. The official reserve account of a country indicates, changes in the country’s reserve assets during a year. It consists of foreign currencies, gold and Special Drawing Rights (SDRs). When current account and capital account are taken together, surplus or deficit is solved from the official resérve account. Therefore balance of payments is always balanced.
4. Errors and Omissions. Besides the three accounts mentioned above there is one more account called ‘Errors and Omissions’. Certain errors and omissions arise due to inaccurate and incomplete information. This is recorded in the Errors and Omissions Account.
Autonomous and Accommodating Transactions All international financial transactions taken up independently without considering balance of payments are called autonomous transactions. All financial trans-actions made by the people with the objective of consuming more and making profits are called autonomous transactions. Export, import, portfolio investment, capital investment, etc., are examples. Autonomous transactions are also called above the line items in Balance of Payments.
Transactions in the Official Reserve Account are called accommodating transactions. It is the effect of autonomous transactions. Accommodating transactions are also called below the line items. Changes in the foreign exchange reserves of the official reserve account, changes in gold and changes in SDRs are examples for accommodating transactions. When Bop becomes surplus or deficit, changes also occur in accommodating transactions. All transactions, except Official Reserve Transactions, are autonomous transactions.| Table 12.2 Autonomous items versus Accomodating items | |
| Autonomous items | Accomodating items |
| 1) International transactions aimed at maximizing profit | Transactions arising due to the dealings of the government |
|---|---|
| 2) Known as ‘above the line items’ | Known as ‘below the line items’ |
| 3) All the transactions in the balance of payments are included | Covers only items under official reserve account |
| 4) Independent items are also included | Covers items of central government central bank related to international economic policies |
Balance of Payment Equilibrium When a country’s foreign exchange earnings from autonomous transactions in a year are equal to its foreign exchange expenditure, it is called BoP equilibrium. That is, when foreign exchange income of a country during a year and its foreign exchange expenditure become equal. Balance of Payments will be in equilibrium.
When inequality occurs, it will be BoP disequilibrium. If autonomous income is more than autonomous expenditure it is called BoP surplus. But if autonomous expenditure is more than autonomous income it is called BoP deficit. If both are equal, we call it BoP equilibrium. Disequilibrium may be caused by BoP surplus or BoP deficit. BoP surplus is called favourable balance of payment. BoP deficit is called unfavourable balance of payment.Foreign Exchange Market The Market where foreign currencies are traded is called foreign exchange market. The main partners in foreign exchange market are commercial banks, foreign exchange brokers, other recognized dealers and monetary authorities.
Exchange Rate Exchange rate is the rate at which one currency is exchanged for another currency. In other words, exchange rate can be defined as the price of one currency in terms of another currency.
Sethu while going to America went to a foreign exchange bank at the Airport to exchange Indian rupees for American dollars. When she paid ₹ 1,20,000 she got $ 2,500. Find the Nominal Exchange Rate. $ 2500 = ₹ 1,20,000 The price of one dollar $1 \(\frac{120000}{2500} \) = ₹ 48 The exchange rate can be expressed in two different ways: 1). The amount of domestic currency required to buy one unit of foreign currency. Example: ₹ 50= $1 means that one should pay ₹ 50 to get 1 dollar. 2). The amount of foreign currency required to buy one unit of domestic currency. Example: 2 cents = ₹ 1. It means that one should pay 2 cents to get ₹ 1.Nominal Exchange Rate In economic literature the first method mentioned above is in practice, and is also called Nominal Exchange Rate or Bilateral Nominal Exchange Rate. Thus, the amount of domestic currency to be paid to purchase one unit of foreign currency (expressed as ₹ 50 = $1) is known as Nominal exchange Rate.
Real Exchange Rate Real Exchange rate is useful to compare the price of foreign goods and domestic goods. The purchasing power of domestic-foreign currencies determines the real exchange rate. The relative price of foreign goods in terms of domestic goods is real exchange rate. In other words, it is the ratio of foreign prices to domestic prices measured in the same currency.
$$ \mathbf{Real\,Exchange\,Rate\,(R)\,=\,\frac{eP_{f}}{P}} $$ e = nominal exchange rate, Pf = price level abroad, P = domestic price level. The numerator eP, measures price level abroad measured in rupees. The denominator P measures the domestic price level in rupees. The real exchange rate is usually considered as a measure of a country’s international competitiveness.Purchasing Power Parity If real exchange rate is 1, it means that currencies are at purchasing power parity. In such a case, goods cost will be the same in two countries when measured in the same currency.
If it is more than one (R > 1) price of foreign goods will be high. If it is less than one (R < 1) the price of domestic goods will be high. A kg of apple costs < 100 in India and $ 2 in America. Suppose Nominal exchange rate is $1 = ₹ 50. Then, \( {Real\,Exchange\,Rate\,(R)\,=\,\frac{eP_{f}}{P}} \) \( =\,\frac{50×2}{100} \) \( =\,\frac{100}{100} \) = 1. It means that goods cost the same in both countries when measured in same currency.Arbitrage
Arbitrage is a process of purchase of foreign currencies from a market where its prices are low and sell in a market where its prices are relatively high. For instance, the exchange rate in Mumbai is $ 1 = ₹ 55 and in New York it is $ 1 = ₹ 50. It would be beneficial for a person involved in arbitrage to purchase dollar from New York and sell it in Mumbai market.
Nominal Effective Exchange Rate – NEER International trade is increasing in the modern world. Today multilateral trade is more common than bilateral trade. Value of currencies change day by day. Like price index, NEER is an index used to determine the fluctuations in the exchange rates of currencies. NEER is an index used to determine the value of a domestic currency with regard to the values of other currencies with which it has economic relationship.
Real Effective Exchange Rate – REER The weighted average of the real exchange rates of all countries having trade relations with a country is called Real Effective Exchange Rate. It represents the quantity of domestic products to be given to buy a fixed quantity of good from abroad.
Determination of Exchange Rate There are three exchange rate systems to determine exchange rate:
1. Flexible Exchange Rate
2. Fixed Exchange Rate
3. Managed Floating Exchange Rate They are explained in detail.
1. Flexible Exchange Rate Flexible exchange rate is also known as floating exchange rate. It is determined by the forces of demand and supply. The central bank does not interfere in determining the flexible exchange rate.
Demand for Foreign Exchange Demand for foreign exchange comes from the demand for foreign goods and services, foreign assets and transfer payments abroad. If the exchange rate is high, import expenditure will go up- So demand for foreign currency will come down. Conversely, if exchange rate is low, imports will go up. Then demand for foreign currency will rise. Demand for foreign currency is negatively related to exchange rate. Therefore, the demand curve for foreign currency slopes down.
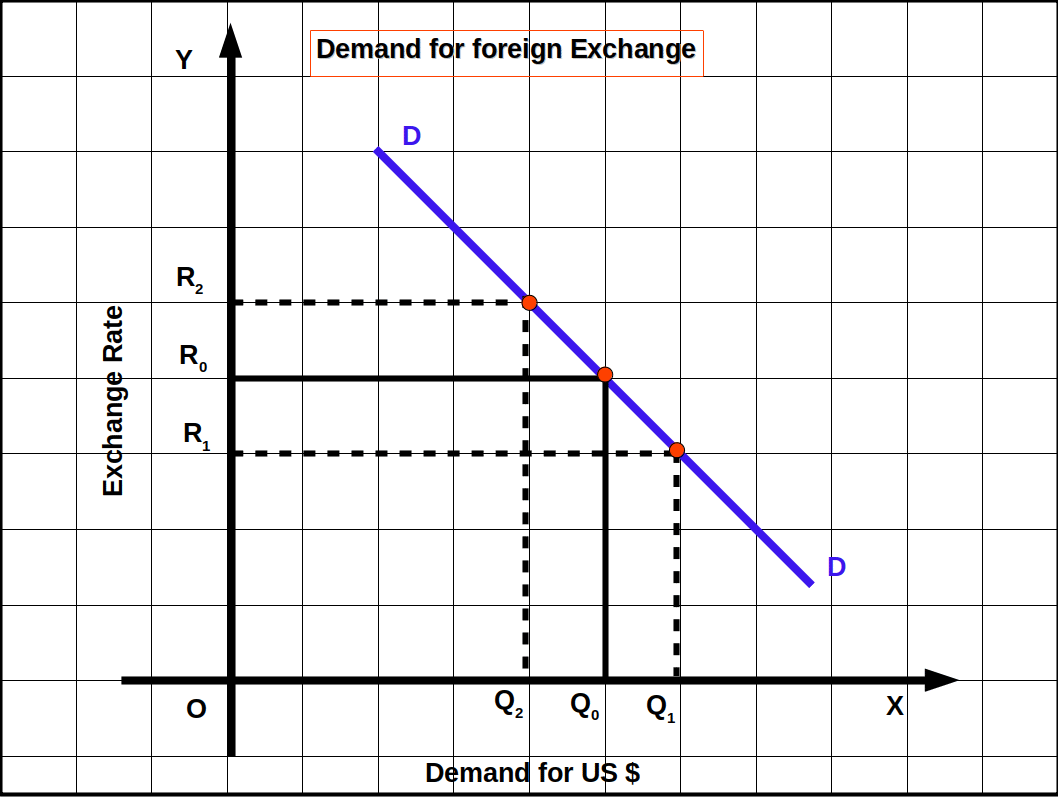 The OX axis represents the demand for US dollars. The OY axis represents the exchange rate of US $ in terms of Indian rupee. DD is the demand curve for foreign exchange. When the exchange rate is R0, the demand for US $ is Q0. When the exchange rate increases to R2, (from R0), the demand for foreign exchange falls to Q2 (from Q0). Similarly, when the exchange rate falls to R1 (from R0), the demand for foreign exchange increases to Q1 (from Q0).
Supply of Foreign Exchange Supply of foreign exchange depends on exports. When exchange tate rises, export will increase. It will increase the flow of foreign currency into the country. So, when exchange rates rise, supply of currency increases, and when exchange rate decreases supply of currency decreases. Exchange rate and supply of currency are positively related. Therefore, the supply curve slopes upwards.
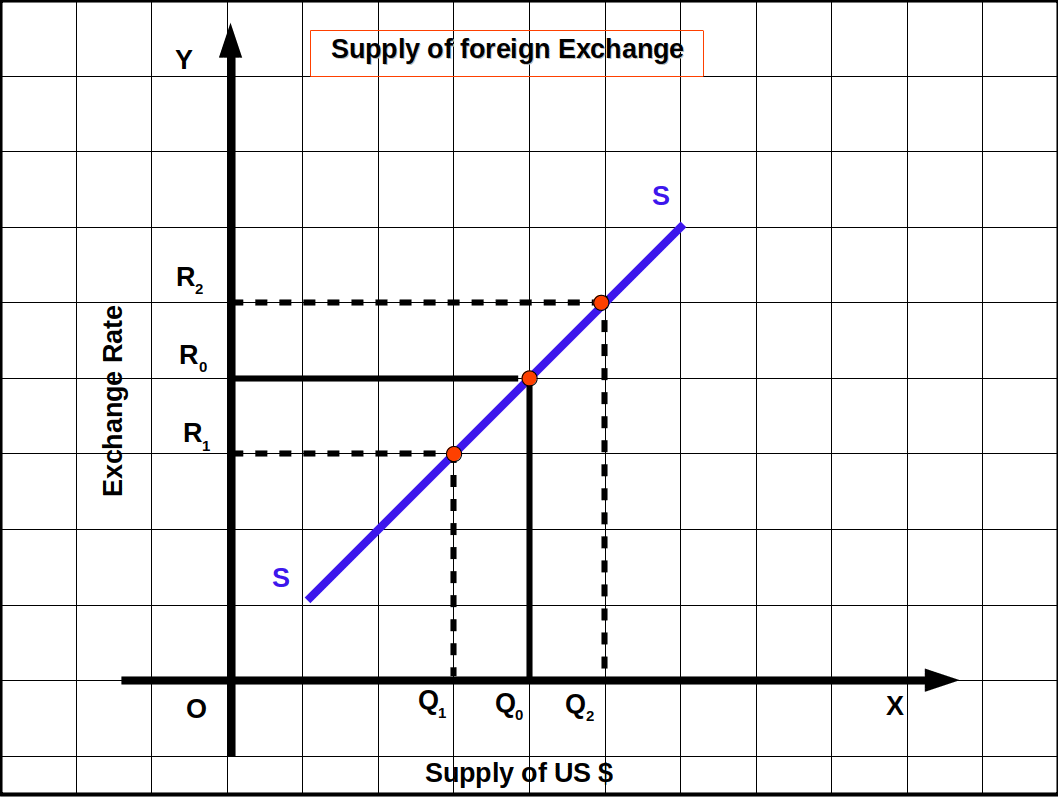 The OX axis represents the supply of US dollars. The OY axis represents the exchange rate of US $ in terms of Indian rupee. SS is the supply curve for foreign exchange. When the exchange rate is R0 , the supply of US $ is Q0 . When the exchange rate increases to R2 (from R0 ), the supply
of foreign exchange rises to Q2 (from Q0 ). Similarly, when the exchange rate falls to R1 (from R0 ), the supply of foreign exchange falls to Q1 (from Q0 ).
The OX axis represents the supply of US dollars. The OY axis represents the exchange rate of US $ in terms of Indian rupee. SS is the supply curve for foreign exchange. When the exchange rate is R0 , the supply of US $ is Q0 . When the exchange rate increases to R2 (from R0 ), the supply
of foreign exchange rises to Q2 (from Q0 ). Similarly, when the exchange rate falls to R1 (from R0 ), the supply of foreign exchange falls to Q1 (from Q0 ).
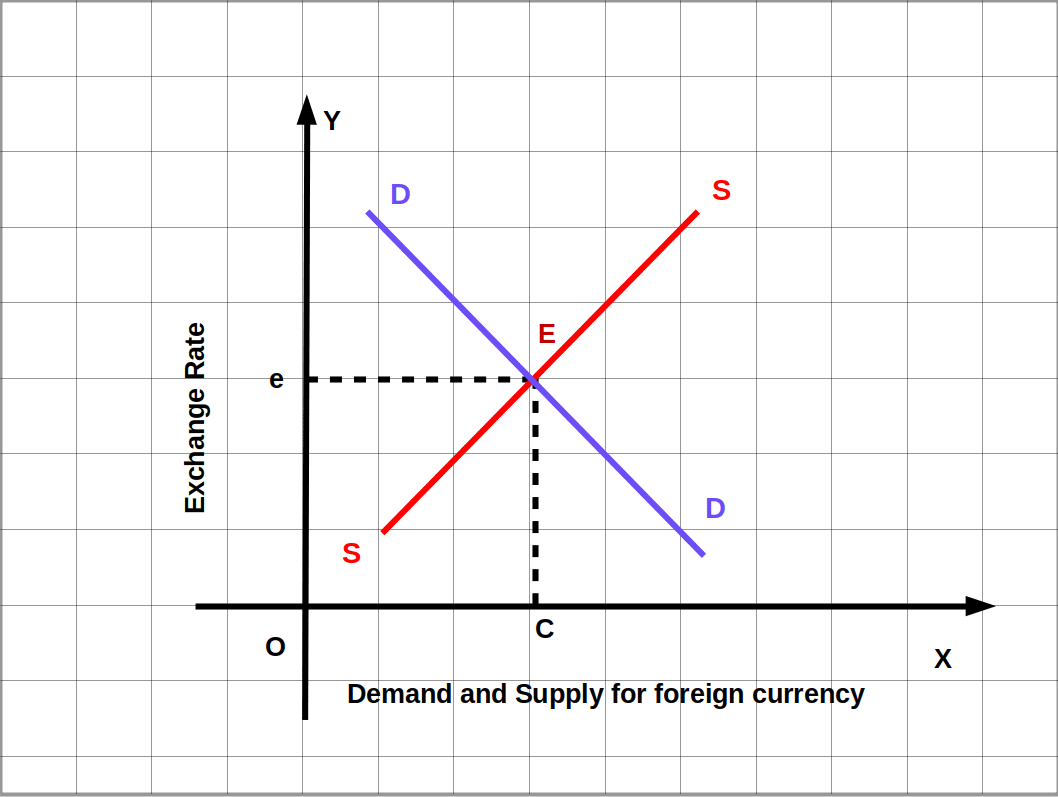
Determination of Equilibrium Exchange Rate When demand for and supply of foreign exchange are equal, it is called equilibrium exchange rate. In the below Diagram. DD is the demand curve of foreign exchange and SS is the supply curve. At point E demand for foreign currency and its supply are equal. OC represents demand and supply of foreign currency. The exchange rate at that point is Oe. Oe is the equilibrium exchange rate. Thus, the exchange rate determined by demand and supply is called floating exchange rate.
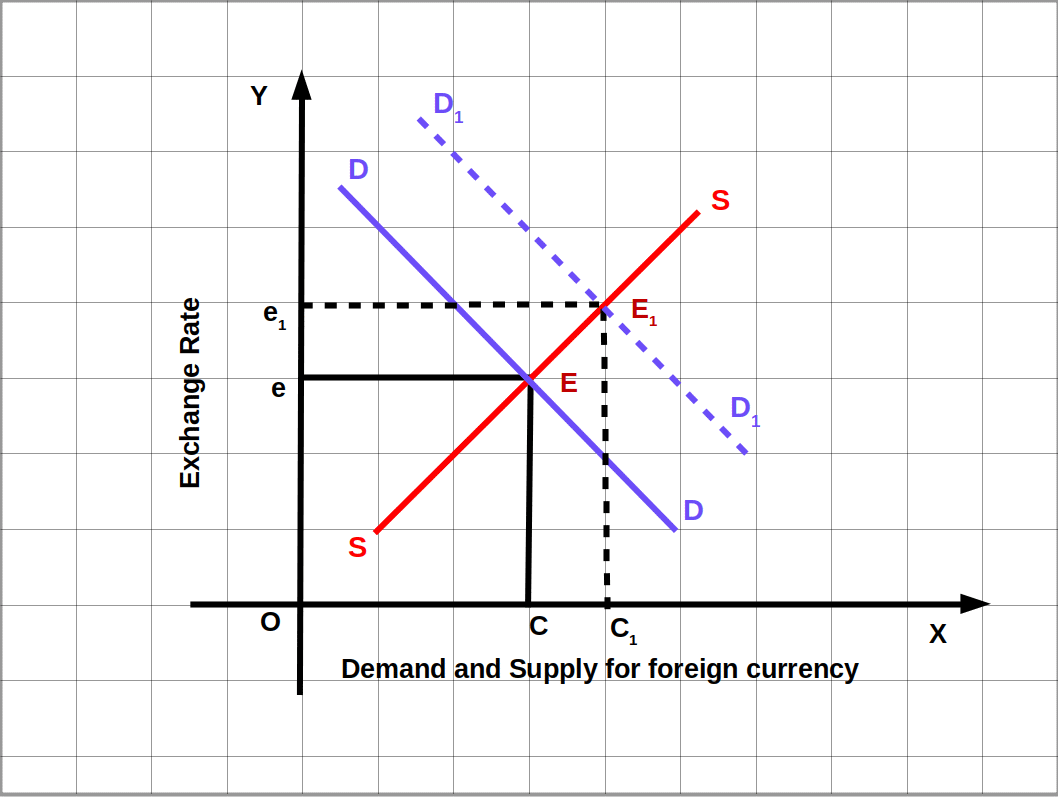
 When demand for foreign currency increases due to higher imports, foreign travel, etc., the demand curve DD shifts to the right as D1D1 as shown in below Diagram. As a result a new equilibrium exchange rate is determined. Then the new equilibrium exchange rate is Oe1. Demand and supply increase from OC to OC1.

Currency Appreciation and Currency Depreciation
Under flexible exchange rate, the value of currency may increase or decrease automatically. The increase in the value of currency is called currency appreciation. i.e., under flexible exchange rate, the increase in value of the domestic currency when foreign currency is exchanged with domestic currency is called currency appreciation. This happens when exchange rates fall.
A decrease in the value of currency is called currency depreciation. i.e., under a flexible exchange rate the decrease in the value of domestic currency when domestic currency is exchanged with foreign currency is called currency depreciation. This occurs when exchange rates rise.Speculation and Exchange Rate An important factor determining exchange rate is speculation. In economies with freely convertible currencies, speculators bet on some currencies. If rupee is expected to depreciate and pound (British currency) is expected to appreciate, speculators will buy pound and sell rupees. So exchange rate will increase. When the expected appreciation in pound happens, speculators sell pounds (at higher rate) and thus make speculative gains. This buying and selling of currencies by speculators influence the exchange rate.
Interest Rate and Exchange Rate Another factor that influences exchange rate is the interest rate prevailing in different countries. The difference in interest rates influences capital flow. The difference between interest rates among different countries leads to movement in capital flows. Capital always flows to countries where better returns are available.. For example, suppose England gives 6% interest to bonds, Germany gives 8% interest to bonds, then, capital will flow from England to Germany. Demand for German currency will increase and demand for British currency will decrease. This will increase the value of German currency and decrease the value of the British currency.
Income and Exchange Rate When income increases import increases. So demand for foreign exchange also increases. The demand curve shifts to the right. Then exchange rate goes up. This leads to decrease in the value of domestic currency and increase in the value of foreign exchange. Conversely, if income increases in foreign countries, domestic export increases. This raises the supply of foreign currency. As a result it leads to a fall in exchange rate. When income from abroad decreases, domestic export will decrease and exchange rate may increase due to fall in supply of foreign currency.
Exchange Rate in the Long Run To predict long run exchange rates under flexible exchange rate system we use the Purchasing Power Parity Theory. This theory says that the exchange rates of two countries will reflect the differences in the price levels of the two countries in the long run.
2. Fixed Exchange Rate Fixed exchange rate is also called pegged exchange” rate. Under the fixed exchange rate, the exchange rate is fixed by the Government / Central Bank. There is a minor difference between fixed exchange rate and pegged exchange rate. Fixed exchange rate will be fixed, but under pegged exchange rate system, the exchange rate is pegged at a Particular level and this may be changed by the Government/monetary authority. This is a policy variable. Even then, the two systems are the same. The central bank intervenes in the foreign exchange market to Correct excess demand or supply.
Under fixed exchange rate System change occurs in the exchange rate due to the deliberate intervention of the Government. In below Diagram e* is the exchange rate fixed by demand and supply. Suppose, here the Government intervenes and brings down exchange rate to e1 level. At e1 exchange rate demand for foreign currency is more than the supply. Here the Government has intervened and thereby increased the value of currency (reduced exchange rate). The value of domestic currency has over-valued. The value of foreign currency has under-valued. In this situation, the central bank will sell AB quantity of foreign exchange reserves in the foreign exchange market to keep the exchange rate steady at e1. If such an action is not taken, exchange rate will go up from e1 to e*.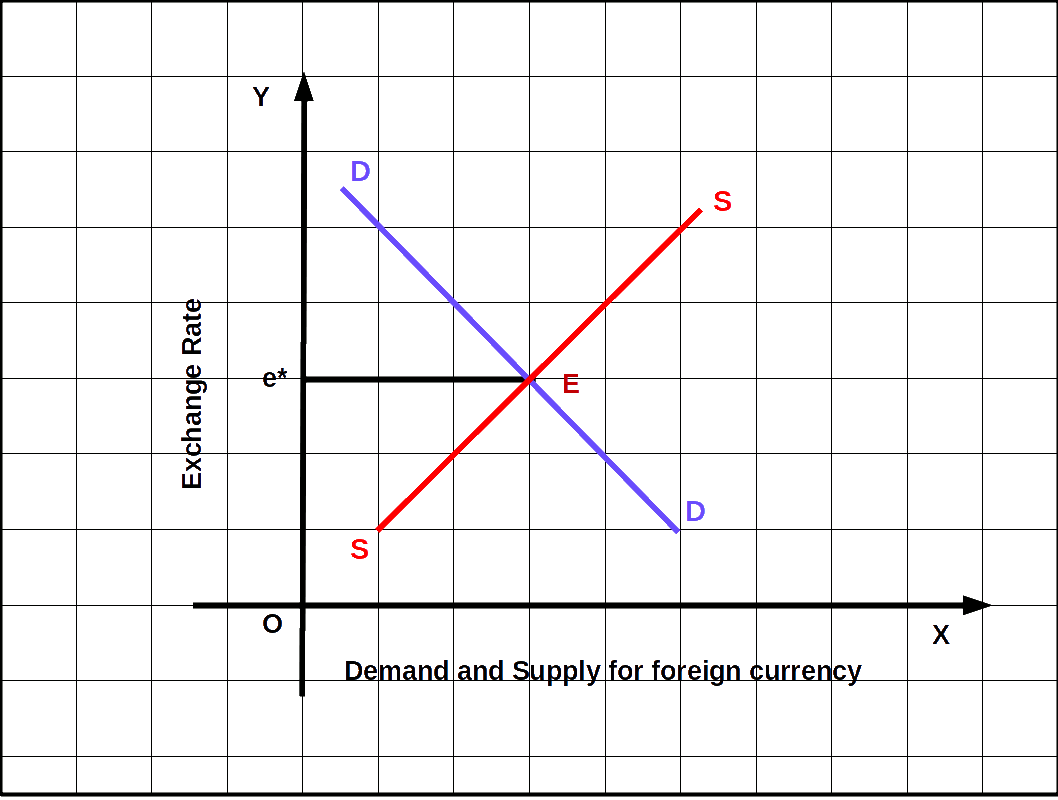 Now, let us suppose that the Government fixes the exchange rate at e2. e2 exchange rate is higher than the market exchange rate e*. So, supply of foreign currency is more than its demand. Here the Government intervenes and the value of the currency is decreased (exchange rate increased). In this situation, to maintain the exchange rate e2 the central bank buys the excess CD of foreign currency supply from the market. If it does not do so, exchange rate will come down from e2 to e*. The exchange rate thus fixed by the central bank is called pegged exchange rate or fixed exchange rate.
Devaluation and Revaluation
Devaluation refers to decreasing the value of domestic currency through official measures under fixed exchange rate system. When the rate of exchange of currency increases, value of currency decreases.
Revaluation refers to increasing the value of domestic currency through official measures under fixed exchange rate system. When the exchange rate of currency decreases the value of currency increases. Devaluation and Revaluation take place through Government measures. But depreciation and appreciation occur due to the forces of demand and supply.3. Managed Floating Exchange Rate It is a mixture of flexible and fixed exchange rate systems. The system is also called dirty floating. Under this system exchange rates are fixed by market forces. But it will be controlled within limits. Government fixes a lower limit and an upper limit of exchange rate. When fluctuation takes place outside these two limits the central bank intervenes in the market and brings the exchange rates within the lower and upper limit earlier fixed by the Government.

Exchange rate fluctuates due to speculation, interest rate, level of income, time periods, etc.
Exchange Rate Determination: International Experience
The Gold Standard Great changes have taken place in exchange rates all over the world. From 1870 to 1914 the prevailing exchange rate. system was the gold standard. The gold standard was a fixed exchange rate system: Under the system all currencies were defined in terms of gold. Each country states that its currency is equivalent to a particular quantity of gold and each country agrees to convert its currency into gold at a fixed price. That means we can convert every currency into every other currency.
Gold standard could not be continued for long. Many factors contributed to its breakdown. As a response to this problem a new form of gold standard called gold exchange Standard was introduced. To solve problems experienced in gold standards it was decided to keep currency reserves in gold or silver. This came to be known as bimetallism. Under the gold exchange standard many countries agreed to exchange their currencies at the fixed rate, but did not keep equivalent gold. Instead, they kept the currency of some large country like US or UK which was on gold standard, as reserves. This system is called gold exchange system.
The Brettonwoods System The Brettonwoods conference held in England in 1944 was a major turning point in monetary history. This conference led to the establishment of the Brettonwoods twins. The International Monetary Fund (IMF) and the World Bank. This also led to a new system of fixed exchange rate. The Brettonwoods system introduced a two-tier convertibility arrangement.
Dollar became the centre of the Brettonwoods system. The US guaranteed to convert dollar into gold at a fixed price of $ 35 for an ounce of gold. This was a first tier. The second tier of the Brettonwoods system was the commitment of each member country of IMF to convert their currency into dollars at a fixed price. This was the official exchange rate. For instance, if India agreed to convert rupee into dollar at ₹ 7 = $ 1 this rate became the official exchange rate. This meant that the convertibility of rupee to gold would be at ₹ 245 = 1 ounce of gold (₹ 245 = $ 35 = 1 ounce of gold). This system became necessary because bulk of the international gold reserves (70%) was in the US. The Brettonwoods arrangement worked smoothly for about two decades. Soon the sustainability of the system became doubtful due to the high balance of payments deficits of the US. There was also the problem of shortage of international liquidity for financing expanding international trade.Special Drawings Rights (SDR) In 1967 the IMF introduced a new currency called Special Drawings Rights (SDRs). This was not a real currency but a unit of account which was accepted in international transactions. The value of SDR was initially linked to gold. But later this was abandoned. Now the value of SDRs is calculated as the weighted sum of the values of four major currencies — Dollar, Euro, Pound and Yen. All member countries agreed to accept SDRs as reserve currency. It is used in payments between Central Banks and in exchanging for other currencies. SDRs were distributed among member countries on the basis of the quota of each country in the IMF.
By late 1960s Brettonwoods system ran into difficulties. In 1967 the pound was devalued. By 1968 there was flight from dollar into gold. In 1971 the British demanded that the US should guarantee the gold value of its dollar holding. This led to the US withdrawing from its commitment to convert dollar into gold in 1971. By early 1970s the floating exchange rate started emerging. The UK, Switzerland and Japan adopted floating exchange rate in the early 1970s. In 1976, the IMF allowed member countries to adopt either fixed exchange rate or the floating exchange rate. Consequently, most countries started moving towards floating exchange rate.The Current Scenario Presently some countries have fixed exchange rates. Some countries have pegged their currencies to the dollar. In 1999 most countries of the European Union agreed to have a common currency. This led to the new currency known as the Euro. The Euro is managed by the European Central Bank (ECB). 24 out of 27 European countries accepted the Euro currency.
In 1991 Argentina introduced currency board-system, but later on they gave it up. In 2002 Equador had to abandon their currency due to acute inflation and they accepted the dollar as their currency. Today most of the countries have turned to flexible exchange rate system, India follows the flexible exchange rate. It is like a managed float system. Gold lost the prominence it had in the past. The main change in the exchange rate system today is that the place of gold has been taken up by some prominent currencies.Exchange Rate Management: The Indian Experience
Indian exchange rate management has evolved over time. After Independence the Indian rupee was pegged to the British currency pound sterling. This was due to India’s historical links to Britain.
A major development in India’s exchange rate policy was the devaluation of the rupee in 1966. The Rupee was devalued by 36.5 percent. In 1975 the rupee was delinked from the pound sterling. In 1991 India faced a major balance of payment crisis. The rupee was devalued by around 19% in two stages – 1st July and 3rd July, 1991. In 1992 a Liberalized Exchange Rate Management System (LERMS) was adopted. LERMS involved dual exchange rates – an official exchange rate and a market exchange rate. Under LERMS, exporters had to surrender 40% of their export earnings at an exchange rate to be determined by the RBI. The balance 60% can be converted at market determined exchange rate. In August 1994, the rupee was made convertible on the current account. But the rupee is not yet convertible on the capital account. Now, our exchange rate system is a flexible one. It can be described as a managed float system.Determination of Income in an Open Economy In an open economy consumers and firms have an option to buy goods and services produced at home (domestic economy) and abroad (foreign countries). There is a distinction between domestic demand for goods and demand for domestic goods. Demand for goods and services from the domestic economy is called domestic demand for goods. It consists of goods produced within the domestic economy and goods imported from abroad. On the other hand, demand for domestic goods means the demand for our goods and services. It comes from domestic economy and foreign economies.
National Income Identity for an Open Economy Aggregate demand for domestic goods in an open economy consists of
- Consumption demand (C)
- Investment demand (I)
- Government demand (G)
- Export demand (X)
- Domestic supply of goods and services (Y)
- Imports (M)
- Y is domestic output or National Income = NI.
- NX is Net export (X – M).
Equilibrium Income in an Open Economy In an open economy (four sector model) product market reaches equilibrium, when aggregate supply (AS) of domestic goods and the aggregate demand (AD) of domestic goods become equal. That is, we can write as follows:
$$ \mathbf{Y=C+I+G+X-M} $$a where, G = C + cYD, YD = Y – T and TR = 0 Then, C = C +c(Y-T),I = I, G = G, X = X, and M = M + mY So, National income identity is Y = C +c(Y-T) + I + G + X – (M + mY) Y = C + cY – cT + I + G + X – M – mY Y – cY + mY = C – cT + I + G + X + M Y(1 – c + m) = C – cT + I + G + X + M If Y* is equilibrium income $$ \mathbf{Y*=\frac{\overline{C}-cT+\overline{I}+\overline{G}+\overline{X}-\overline{M}}{1-c+m}} $$ $$ \mathbf{=} $$ $$ \mathbf{Y*=\frac{\overline{A}}{1-c+m}} $$ where, A = C – cT + I + G + X + M
\( \mathbf{\frac{ΔY}{ΔA}} \) = \( \mathbf{\frac{1}{1-c+m}} \) is called the open economy autonomous expenditure multiplier.
Export Multiplier The effect of change in income with respect to change in export is called export multiplier. It is the ratio of change in income (ΔY) to change in export (ΔX).

Import Multiplier The effect of change in income with respect to change in import is known as import multiplier. It is the ratio of change in income (ΔY) to the change in import (ΔM).
 Import multiplier is negative.
It means that if there is an increase of ₹1 in autonomous import, income will decrease by \( \frac{1}{1-c+m}\) times.
Import multiplier is negative.
It means that if there is an increase of ₹1 in autonomous import, income will decrease by \( \frac{1}{1-c+m}\) times.
- Find export multiplier and import multiplier
- Find equilibrium income
- What is the increase in income if there is an increase of ₹ 5 in export?
- What is the change in equilibrium income if autonomous import increases by ₹ 5 ?
- Export multiplier = \( {\frac{ΔY}{Δ\overline{X}}} = {\frac{1}{1-c+m}} \) Import Multiplier \( =\,{\frac{ΔY}{Δ\overline{M}}}\,=\,{\frac{-1}{1-c+m}} \)
- DD = \( {Y\,=\,\frac{\overline{A}}{1-c+m}} \) \( {=\,\frac{91.25}{1-.75+.05}} \) \( {=\,\frac{91.25}{.3}} \) = 304.17
- \( {ΔY\,=\,\frac{Δ\overline{X}}{1-c+m}} \) \( {=\,\frac{5}{1-.75+.05}} \) \( {=\,\frac{5}{.3}} \) = 16.67
- \( {ΔY\,=\,\frac{-Δ\overline{M}}{1-c+m}} \) \( {=\,\frac{-5}{1-.75+.05}} \) \( {=\,\frac{-5}{.3}} \) = -16.67
Equilibrium Output and the Trade Balance We shall now describe the diagrammatic explanation of equilibrium level of output and the trade balance in an open economy. Net exports (NX = X – M) depend on Y (domestic income), Y, (foreign income) and R (exchange rate). An increase in Y raises import expenditure and leads to trade deficit. Other things being equal, an increase in Y, raises exports, creates a trade surplus and raises aggregate income.
In below given Diagram, the curve AD = C+1+ G shows domestic demand (as in a closed economy). Curve AA shows demand for domestic goods. By deducting imports from domestic demand curve AD we will get the curve AA. That is, domestic demand minus imports (AD – M = AA). Curves AD and AA are an increasing function of income. AA curve is flatter than AD. The slope of AD is MPC and the slope of AA is MPC – MPM. The distance between AD and AA is imports. The curve DD shows the aggregate demand in an open economy. By adding exports to line AA we get line DD (DD = AA + X). The distance between DD and AA is equal to exports and these lines are parallel. Their slopes are similar.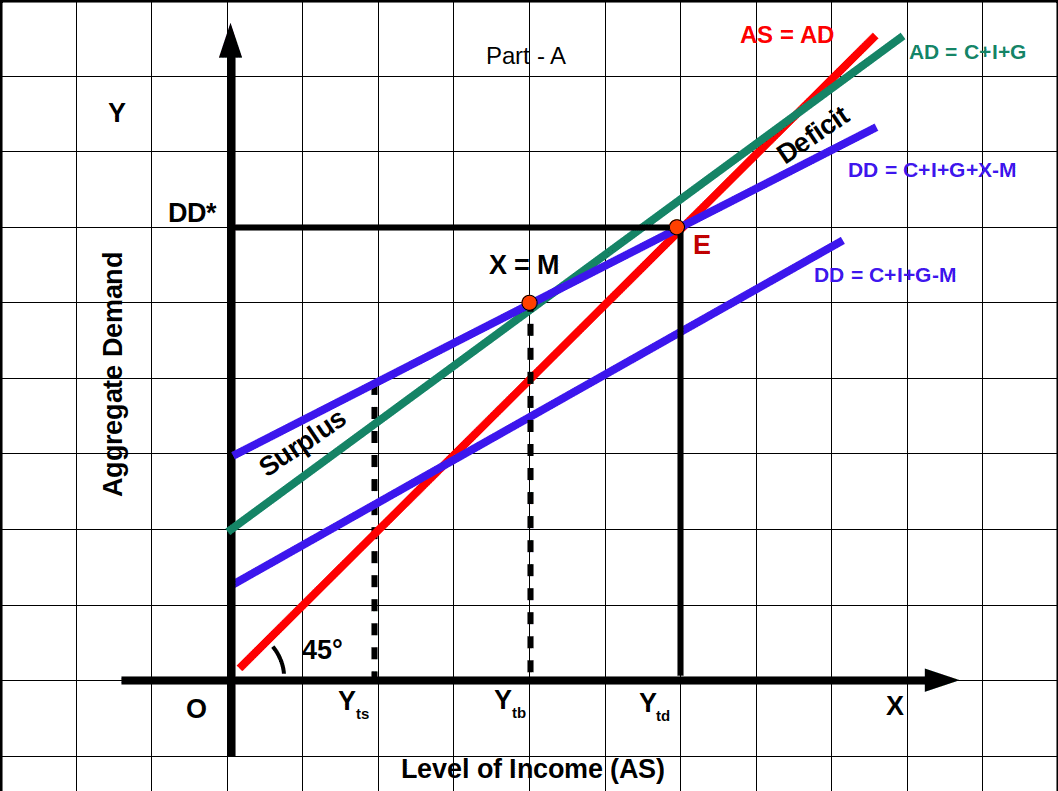
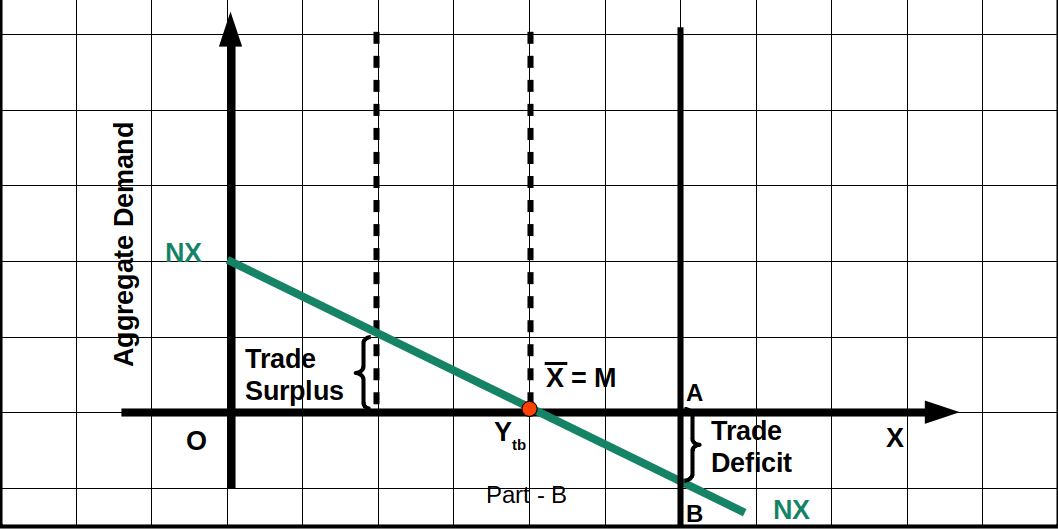 Net export is given in part B. This is diminishing function of income. In an open economy, the goods market is in equilibrium when supply of domestic output and demand for domestic output become equal. DD line intersects the 45° line at point E. This is the equilibrium point. Then equilibrium income is Ytd, and equilibrium domestic demand is DD*. At point E, Y = C + 1 + G + X – M. When the open economy is in equilibrium the economy experiences trade deficit. NX line is negative. AB shows the trade deficit.
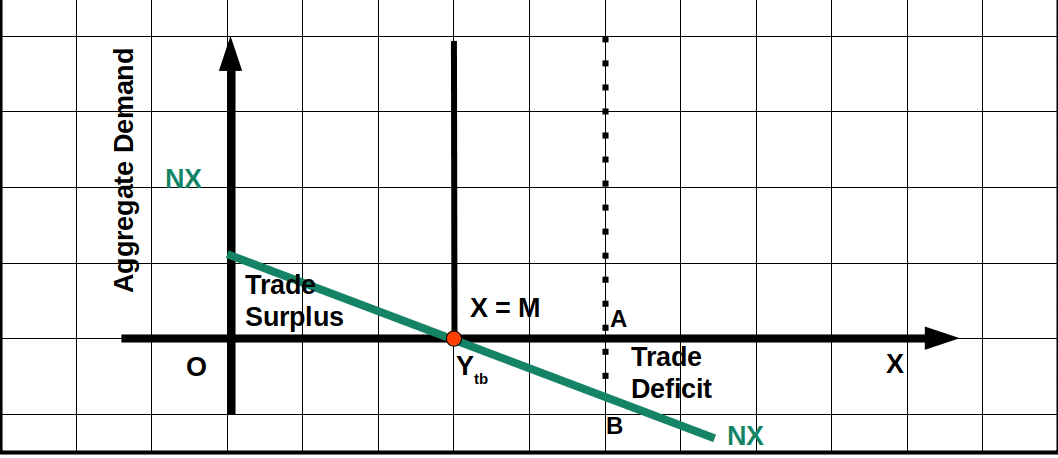
At equilibrium, the economy need not have trade balance. It may be either trade balance, or surplus or deficit. It is shown in below Diagram.
Net export is given in part B. This is diminishing function of income. In an open economy, the goods market is in equilibrium when supply of domestic output and demand for domestic output become equal. DD line intersects the 45° line at point E. This is the equilibrium point. Then equilibrium income is Ytd, and equilibrium domestic demand is DD*. At point E, Y = C + 1 + G + X – M. When the open economy is in equilibrium the economy experiences trade deficit. NX line is negative. AB shows the trade deficit.
At equilibrium, the economy need not have trade balance. It may be either trade balance, or surplus or deficit. It is shown in below Diagram.
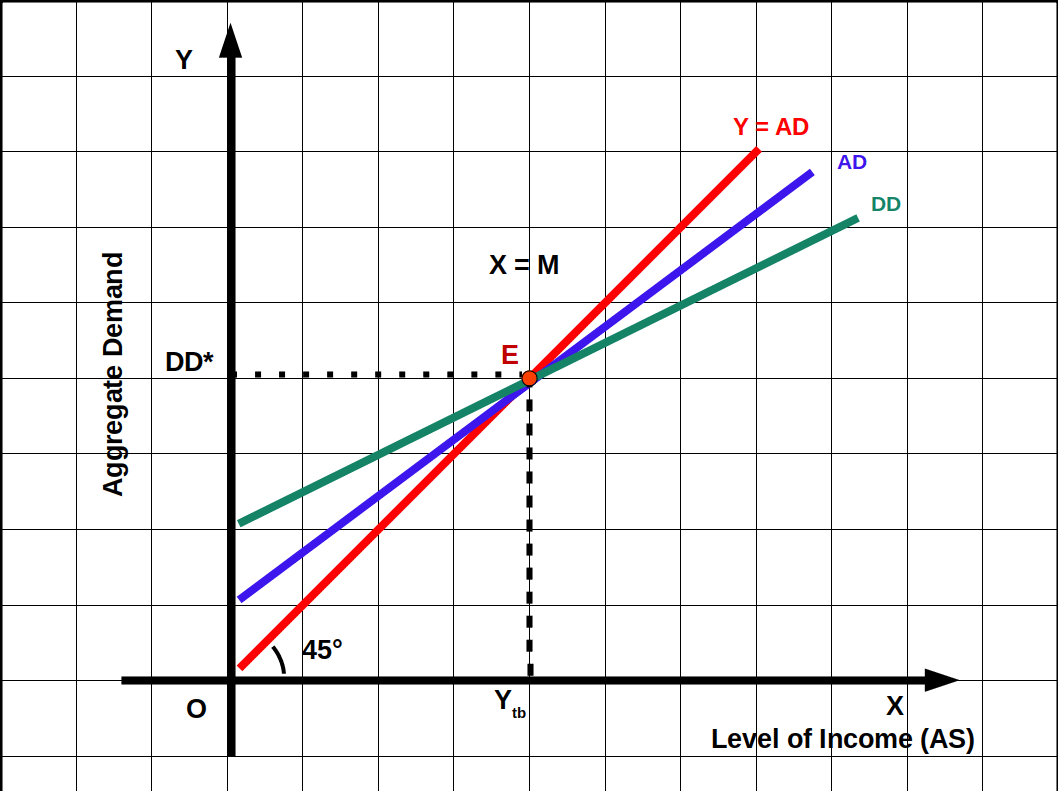
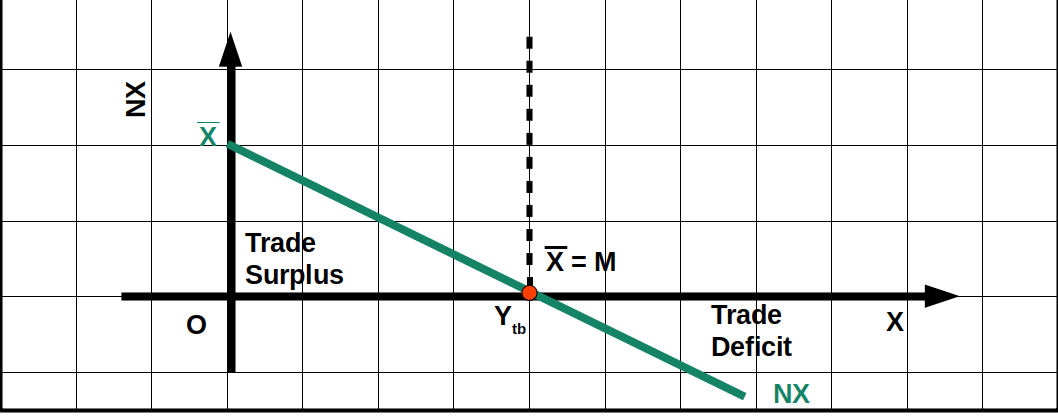 At the point of intersection of line DD and AD, export and import are equal. At Ytb level of income X = M. Before income level Ytb NX is positive. Then we have trade surplus. After income level of Ytb NX is negative. Then we experience trade deficit.
Effects of Increase in Autonomous Expenditure and Net exports We shall discuss effects of increase in autonomous expenditure and net exports with the help of a diagram.
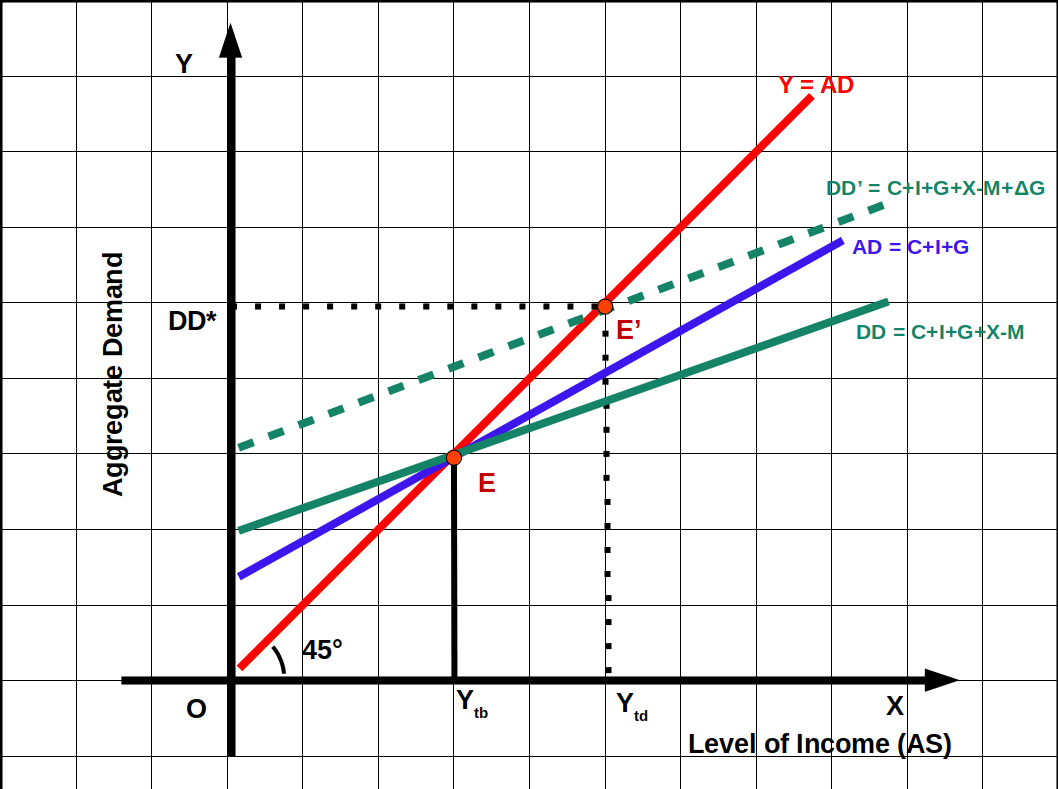
 If we increase Government expenditure by ΔG, to find the impact of autonomous expenditure on equilibrium income, domestic demand DD = C + I + G + X – M becomes DD’ = C + I + G + X – M + ΔG. Line DD
shifts upwards and become DD’ which is parallel to DD line as shown in the above given Diagram. The new equilibrium point moves up from E to E’. Then equilibrium income increases from Ytb to Ytd. Prior to increase in Government expenditure economy which was in trade balance has now become in trade deficit. AB is the trade deficit. A part of increase in income leads to increase in import. Export is constant.
If we increase Government expenditure by ΔG, to find the impact of autonomous expenditure on equilibrium income, domestic demand DD = C + I + G + X – M becomes DD’ = C + I + G + X – M + ΔG. Line DD
shifts upwards and become DD’ which is parallel to DD line as shown in the above given Diagram. The new equilibrium point moves up from E to E’. Then equilibrium income increases from Ytb to Ytd. Prior to increase in Government expenditure economy which was in trade balance has now become in trade deficit. AB is the trade deficit. A part of increase in income leads to increase in import. Export is constant.
Interdependent Incomes – Increase in Foreign Demand The direct effect of increase in income from abroad (Yf) is an increase in export. Increase in Yf leads to increase in domestic income through multiplier process. Increase in income will increase import. This increase in import does not affect the increase in export. So there will be trade surplus. Conversely, if there is recession abroad it will decrease domestic export. Then there will be trade deficit. Any recession or boom in any of the countries will affect other countries through international trade.
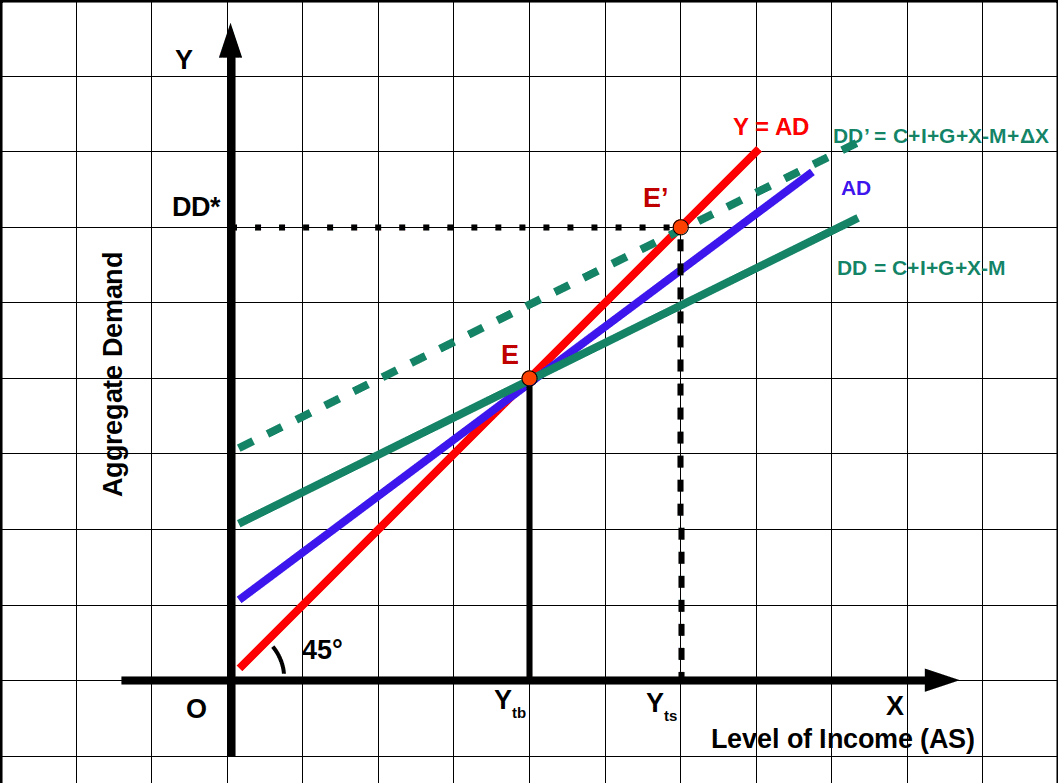
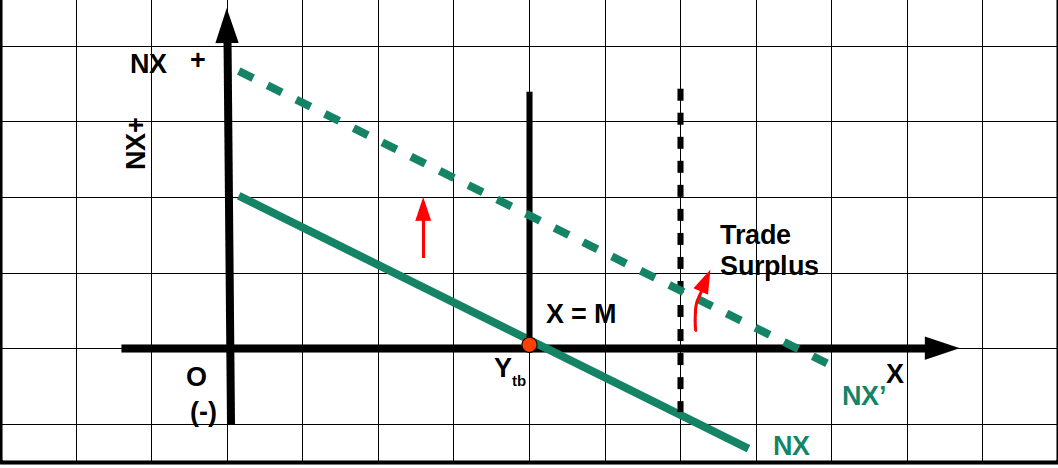 In the above Diagram , as a result of increase in autonomous export (ΔX) DD line shifts to DD’. The equilibrium point moves from E to E’. Income increases from Ytb to Yts. At income level Ytb the economy is trade surplus. As a result of increase in export, net export shifts from NX to NX’. At income level. Yts the economy is in trade surplus. Line NX’ is parallel to line NX. The distance between NX and NX’ is represented by ΔX.
Change in Prices Changes in price affect domestic demand and income. If prices of domestic products decrease domestic export will increase. That will raise our output and income. Conversely, if the prices of domestic products increase our exports will come down. So output and income will come down. Similarly, price rise abroad will boost our exports. It will lead to increase in domestic output and income. The opposite will be the result if the prices abroad fall.
Changes in Exchange Rate Changes in exchange rate also affect output and income. Changes in nominal exchange rates bring about change in real exchange rate which leads to changes in relative prices abroad. When the rupee becomes weak (depreciation), it increases export and consequently it will raise the demand for domestic goods. Conversely, when the rupee becomes strong (appreciation), export may decrease and import may increase. This will reduce both demand for domestic goods and income.
Trade Deficits, Savings and Investment Trade affects savings and investment in the economy. Money inflows into the economy can alter savings, investment and thereby the growth rate of the economy.
In a closed economy savings will be equal to investment (S = I). The equality will be brought about by equilibrium interest rate. In an open economy, S need not be equal to I.We have seen that
y = C + I + G + (X – M)
or
y = C + I + G + NX
or
y – C – G = I + NX
y – C – G is total savings. This is the balance in income after meeting consumption expenditure and government expenditure. Therefore, we can rewrite the equation as:S = I + NX
So, while in a closed economy S = I, in an open economy S = I + NX. Savings has two components – private savings (Sp) and government savings (Sg).S = Sp + Sg
Therefore,
S = Sp + Sg = I + NX
or
(Sp – I) + Sg = NX
Government saving is the balance from tax income after meeting government expenditure (T – G). Therefore,(Sp – I) + (T – G) = NX
Is trade deficit a cause of concern ? Temporary trade deficits caused by unexpected increase in the price of imports need not be a cause for concern. But sustained trade deficits over a long period of time can cause problems like increasing foreign debt, rising interest burden and debt trap. If trade deficit leads to lesser saving and declining investment it can be a cause for concern. The twin deficit problem – trade deficit and budget deficit – can wreck havoc on the economy. On the other hand, if trade deficit is accompanied by rising saving and investment, it can lead to higher growth without debt trap.
![]()
0 Comments