Plus One Economics Chapter 17
Chapter 17 :-

Introduction So far we had studied about series where various items assume different values of one variable, for example, height of a student. These types of data are called univariate data. There can, however, be such series also where each item assumes the values of two or more variable. For example, if the heights and weights of a group of students are measured we shall get a bivariate data. Here, each member of the group would assume two values ~ one relating to height and the other relating to weight. If besides heights and weights, the chest measurements were also taken, each member of the group would assume three values relating to three different variables. Here we study only bivariate data.
Sometimes, it appears that the values of the various variables so obtained are inter-related. For example, if the data are collected about the prices of a commodity and the quantities sold at different prices, two series would be obtained. One variable would be the various prices of the commodity and the other variable would be the quantities sold at these prices. We can see some relationship between these two series, such as, with increase in price, the quantity sold may bind to decrease. Such relationship can be found in many types of series; for example, heights and weights of people. price and demand of a commodity, petrol price and taxi fare, etc.
Meaning and Definition
The relationship between any two or more variables is referred to as correlation. That is, two variables are said to be correlated, if with a change in the value of one variable, there arises a change in the value of the other variable also. Correlation studies and measures the intensity of relationship among variables. It should never be interpreted as implying cause and effect relation.The presence of correlation between the variables X and Y simply means that when the value of one variable is found to change either in the same direction or in the opposite direction in a definite manner.
Types of Correlation
Consider two variables, height and weight of students. These two variables have correlation. That means a change in the value of height will result in a change in the value of weight and vice-versa. For another instance, consider the price of mango and quantity demanded. Here also the two variables, price and demand, have correlation. Now. what happens to the weight of a student as his {eight increases; and, what happens to the demand of mango as its price increases? Normally, weight of a student increases as his height increases; but, demand of mango decreases as its price increases. In the first case, the correlation is positive and in the second case it is negative.When the values of two variables move in the same direction, the correlation is said to be positive; and when the values of two variables move in the opposite direction, the correlation is said to be negative. That is, if value of one variable increases with an increase (and decreases with a decrease) of the value of the other variable, they are said to be in positive correlation. Likewise, if value of one variable increases with a decrease (and decreases with an increase) of the value of the other variable, they are said to be in negative correlation.
When the change in one variable tends to bear a constant ratio to the change in the other variable, then correlation is said to be linear.
| Table 7.1 | |
|---|---|
| x | Y |
| 100 | 700 |
| 200 | 1400 |
| 300 | 2100 |
| 400 | 2800 |
If the amount of change in one variable does not bear a constant ratio to the change in the other variable, correlation is called Non-linear or Curvi-linear Correlation.
 Correlation is said to be linear if the plotted points lie near the line of best fit. In case of curvi linear correlation the scatter of points lie around a curve and not around a straight line.
The study of correlation between two variables is called simple correlation. Example: Study of correlation between height and weight.
When more than two variables are studied it is a problem of either multiple or partial correlation. In multiple correlation the correlation between three or more variables is studied. For example, if we study the relationship between age, weight and height of students, it is a case of multiple correlation. In partial correlation study, we measure the correlation between two variables only keeping constant the influence of other variables. In the above example, if we ignore the variable weight and study the correlation between age and height, it is a study of partial correlation.
Techniques for Measuring Correlation
There are many techniques to measure correlation. The widely used techniques are:
-
Scatter diagrams
-
Karl Pearson’s coefficient of correlation
-
Spearman’s rank correlation
1. Scatter Diagram Method (Correlation Chart)
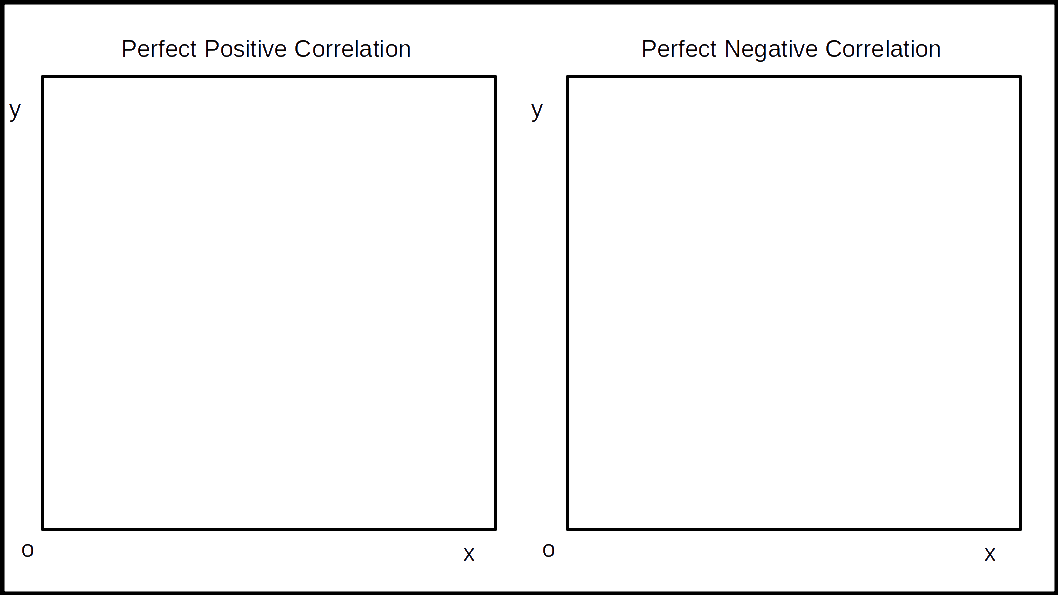
This is the simplest method of studying correlation between two variables. When this method is adopted the given data are plotted on a graph paper in the form of dots. For each pair of X and Y values we put a dot and thus we get as many dots on the graph paper as the number of observations. By looking at the scatter of dots on the graph paper we can form an idea as to the degree of correlation between the variables.If the plotted points lie on a straight line rising from the lower left hand corner to the upper right hand corner, correlation is said to be perfectly positive. On the other hand, if the points are lying on a straight line falling from the upper left hand corner to the lower right hand corner, correlation is said to be perfectly negative. When there is perfectly positive correlation, correlation coefficient (r) is said to be +1 and when it is perfectly negative, correlation coefficient (r) is equal to -1.
When the plotted points fall in a narrow band and if they show a falling trend from the upper left hand corner to the lower right hand corner, there would be high degree of negative correlation.
 When the plotted points are widely scattered over the diagram and still if the points exhibit a rising trend from the lower left hand corner to the upper right hand corner, it is an indication of low degree of positive correlation. On the other hand when the plotted points are scattered over the diagram and if they show a falling trend from the upper left hand corner to the lower right hand corner, we are to understand that there is low degree of negative correlation.
 If the plotted points are widely scattered in the haphazard manner or if they lie on a straight line parallel to the X axis, it shows that there is no relationship between the variables, t.e., r= 0.


MERITS OF SCATTER DIAGRM
- It is a simple and non-mathematical method of studying the relationship between two variables. As such it can be easily understood.
- It is not influenced by the size of extreme items.
- Just at a glance one can form an idea about the relationship between’ the variables.
- Usually it is the first step in investigating the relationship between two variables.
DEMERITS OF SCATTER DIAGRM
- It does not give a numerical measurement of the correlation.
- It can at the most give only an approximate idea of the relationship, whether it is high or low. But we cannot establish the exact degree of correlation between the variables.
2. Karl Pearson’s Coefficient of Correlation
Of the very many methods of measuring correlation, Karl Pearson’s method, also known as Pearsonian Coefficient of Correlation is the most widely used method. Karl Pearson’s Coefficient of Correlation is denoted by the symbol r.$$ \mathbf{r\, = \,{\frac {Σxy}{Nσ_xσ_y}}} $$ $$ \mathbf{x\, = \,(X\,-\,\overline{X})} $$ $$ \mathbf{y\, = \,(Y\,-\,\overline{Y})} $$ $$ \mathbf{σ_x\, = \,Standard\,Deviation\,of\,Series\,X} $$ $$ \mathbf{σ_y\, = \,Standard\,Deviation\,of\,Series\,Y} $$ $$ \mathbf{N\, = \,Number\,of\,pairs\,of\,observations} $$ The formula shall be applied only when deviations are taken from actual mean. The value of r obtained by the above formula shall always lie between ±1. The above formula can be modified as follows.
$$ \mathbf{r\, = \,{\frac {Σxy}{\sqrt{{Σx^2×Σy^2}}}}} $$ $$ \mathbf{x\, = \,(X\,-\,\overline{X})} $$ $$ \mathbf{y\, = \,(Y\,-\,\overline{Y})} $$ The nature of correlation for different values of r is given in the following table:
| Table 7.2 | |
|---|---|
| Value of r | Nature of correlation |
| -1 | Perfect negative correlation |
| 0 | No correlation |
| + | Perfect positive correlation |
| Greater than 0 but less than 1 | Positive correlation |
| Less than 0 but greater than 1 | Positive correlation |
![]()
0 Comments